Cash Flow from Continuing Operations up 16% Quarter-Over-Quarter to record
This press release features multimedia. View the full release here: https://www.businesswire.com/news/home/20261103366765/en/
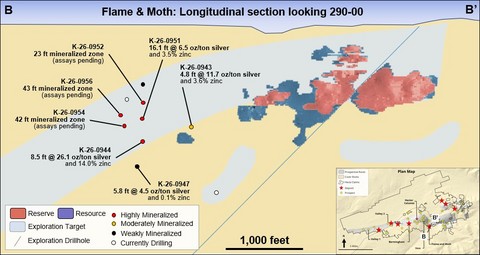
Figure 1: Flame & Moth longitudinal section showing the new extension, holes 944 and 951, and the 900-foot gap to the existing resource
THIRD QUARTER 2026 HIGHLIGHTS
Financial Performance:
- Revenue:
$395 million from continuing operations, the second highest in company's history. - Profitability: Income from continuing operations of
$150 million or$0.22 per share - up from$118 million or$0.18 per share in the prior quarter. - Adjusted EBITDA:
$211 million from continuing operations, a 6% increase over the prior quarter (both periods on a continuing operations basis, excludingCasa Berardi ).4 - Record cash flow generation: Cash flow generated from continuing operations of
$203 million , and record quarterly free cash flow from continuing operations of$151 million ;Greens Creek set a new site-level quarterly record of$147 million .1 - Strengthening balance sheet: The Company ended the quarter with
$692 million of cash and cash equivalents, reflecting continued balance sheet strength and strategic flexibility. The Company remains debt free (excluding finance leases) and has entered into a new$500 million revolving credit agreement with an additional$100 million accordion option. The facility is undrawn, with$3.4 million of capacity currently utilized for outstanding letters of credit. This is the strongest balance sheet position in the Company's history.
Corporate Matters:
- New Director: Mr.
Dale Andres has joined the Board of Directors.Mr. Andres is a mining executive with over 35 years of experience in base and precious metals.
Operational Performance:
- Operations:
- Safety: Consolidated TRIFR of 1.51, down from 1.57 in the prior quarter.
- Silver production from continuing operations was 4.2 million ounces, nearly unchanged from the prior quarter, with consolidated silver sales volumes stronger, reflecting the timing of shipments, mainly at
Greens Creek . - Consolidated costs applicable to sales from continuing operations of
$158 million , up 35% from the prior quarter due primarily to the timing of sales. Silver cash cost remained negative at ($3.20 ) per ounce and AISC was$14.34 per ounce (excludingKeno Hill , which has not yet achieved commercial production). Year-to-date AISC of$9.37 /oz is essentially in line with$9.26 /oz a year ago, and YTD cash cost improved to ($4.94 )/oz from ($2.20 )/oz.2,3,5 - Production and cost guidance: Consolidated 2026 silver production is expected to be 15.3-16.1 million ounces, with low end raised compared to prior guidance of 15.1-16.1 million ounces. Consolidated silver cash cost and AISC guidance improved to (
$4.75 )-($4.25 )/oz and$11.50-$12.50 /oz respectively,2,3 on outperformance during the first nine months of the year, reduced sustaining capital investment guidance, and higher by-product credits.2,3 See Guidance section for more details.
- Individual Mine Performance:
Greens Creek : Produced over 1.9 million ounces of silver and nearly 12 thousand ounces of gold. Costs applicable to sales were$76 million , with silver cash cost of ($10.11 ) per ounce and AISC of ($3.25 ) per ounce.2,3,5Lucky Friday : Produced nearly 1.3 million ounces of silver. Costs applicable to sales were$34 million , with silver cash cost of$7.31 per ounce and AISC of$27.68 per ounce.2,3,5 The surface cooling project is expected to commission in the fourth quarter.Keno Hill : Produced nearly 1.0 million ounces of silver. Milled silver grade improved more than 35% from the prior quarter and milling rates reached a new quarterly record. Milling rates will be suppressed beginning in the fourth quarter to preserve the tailings storage, waste rock and water treatment capacity available under current permits while license amendments are pursued (see "Keno Hill Update" below).- Growth pipeline: Preliminary work on the
Greens Creek pyrite concentrate continues, and has led to a revision to growth capital expenditure guidance forGreens Creek . Subject to final investment approval, intermittent production using temporary equipment could begin in late 2027 with potential to reach full capacity in late 2028, when construction of the new circuit is expected to be completed. Separately, the scope of theGreens Creek dry-stack tailings reprocessing evaluation has broadened to include two additional potential paths forward, or a combination of them. InNevada , 2026 exploration investment guidance of$16 million is more than three times the 2025 level with expanded programs at Midas and new programs atHollister and Aurora. See "Project Pipeline Update" section below for further details. - Exploration: Exploration success continued in the third quarter, led by the discovery of a new mineralized extension at
Keno Hill's Flame & Moth, 900 feet southwest of the existing resource; ongoing progress along theBermingham trend toward the historicHector-Calumet Mine ; and massive sulfide intercepts at Greens Creek’s West Ore Offset target, with assays pending. Hecla also commenced drilling inNevada at Aurora andHollister and continued follow-up drilling on the new high-grade veins discovered at Midas in the second quarter.
FINANCIAL AND OPERATIONAL OVERVIEW
In the following table and throughout this release, "costs applicable to sales" is exclusive of depreciation, depletion and amortization; "prior quarter" refers to the second quarter of 2026. All information in the table below is presented on a continuing operations basis.
In thousands (except per ounce amounts) | 3Q-2026 | 2Q-2026 | 1Q-2026 | 4Q-2025 | 3Q-2025 | YTD-2026 | YTD-2025 |
Financial Highlights |
|
|
|
|
|
|
|
Sales | |||||||
Costs applicable to sales (5) | |||||||
Depreciation, depletion and amortization | |||||||
Income and mining tax provision | |||||||
Income from continuing operations | |||||||
Basic income per common share (in dollars) from continuing operations | |||||||
Adjusted EBITDA from continuing operations (4) | |||||||
Cash provided by operating activities from continuing operations | |||||||
Capital investment in continuing operations | |||||||
Free cash flow from continuing operations (1) | |||||||
|
|
|
|
|
|
|
|
Free cash flow 1 by operation (before exploration and corporate costs) |
|
|
|
|
|
|
|
|
|
|
|
|
|
| |
Cash flow from operations | |||||||
Exploration | |||||||
Capital investment | |||||||
Free cash flow (1) | |||||||
|
|
|
|
|
|
| |
Cash flow from operations | |||||||
Exploration | |||||||
Capital investment | |||||||
Free cash flow (1) | |||||||
|
|
|
|
|
|
| |
Cash flow from operations | |||||||
Exploration | |||||||
Capital investment | |||||||
Free cash flow (1) | |||||||
|
|
|
|
|
|
|
|
Metals Prices |
|
|
|
|
|
|
|
Average metal prices |
|
|
|
|
|
|
|
Silver - London PM Fix, $/ounce | |||||||
Gold - London PM Fix, $/ounce | |||||||
Lead - LME Final Cash Buyer, $/pound | |||||||
Zinc - LME Final Cash Buyer, $/pound | |||||||
Realized Prices |
|
|
|
|
|
|
|
Silver, $/ounce | |||||||
Gold, $/ounce | |||||||
Lead, $/pound | |||||||
Zinc, $/pound |
THIRD QUARTER RESULTS
Sales of
Income from continuing operations was
- An 18% increase in revenue from continuing operations for the items noted above
- A
$36 million increase in fair value adjustments, net, primarily due to realized and unrealized marketable securities gains
Partly offset by:
- A
$41 million increase in costs applicable to sales primarily related to higher consolidated sales volumes of concentrates5 - A
$22 million increase in tax expense primarily related to higher profitability compared to the prior quarter - A
$6 million increase in exploration and pre-development expense, primarily related to the seasonal increase in exploration activities across the portfolio and the start up of programs atHollister and Aurora inNevada
Adjusted EBITDA from continuing operations was
Cash and cash equivalents at
Record cash provided by operating activities from continuing operations was
Capital investment in continuing operations was
Record free cash flow from continuing operations was
In thousands (except per ounce amounts) | 3Q-2026 | 2Q-2026 | 1Q-2026 | 4Q-2025 | 3Q-2025 | YTD-2026 | YTD-2025 |
Operational Highlights |
|
|
|
|
|
|
|
Milled tons (tons) |
|
|
|
|
|
|
|
207,638 | 217,433 | 208,922 | 200,952 | 227,587 | 633,993 | 670,707 | |
100,545 | 101,978 | 108,608 | 98,499 | 105,329 | 311,131 | 328,549 | |
38,163 | 33,504 | 24,274 | 24,417 | 29,740 | 95,941 | 83,922 | |
Milled silver grade - (opt) |
|
|
|
|
|
|
|
11.7 | 12.0 | 13.0 | 12.2 | 13.1 | 12.2 | 12.8 | |
13.2 | 15.6 | 11.9 | 13.4 | 13.4 | 13.6 | 12.9 | |
26.2 | 19.3 | 20.8 | 25.4 | 31.8 | 22.4 | 30.0 | |
Silver production |
|
|
|
|
|
|
|
1,935,193 | 2,051,022 | 2,177,142 | 1,951,784 | 2,347,674 | 6,163,357 | 6,773,212 | |
1,272,585 | 1,532,569 | 1,237,288 | 1,250,204 | 1,337,353 | 4,042,442 | 4,010,482 | |
963,048 | 625,236 | 488,719 | 597,020 | 898,328 | 2,077,003 | 2,421,470 | |
Total, ounces | 4,170,826 | 4,208,827 | 3,903,149 | 3,799,008 | 4,583,355 | 12,282,802 | 13,205,164 |
Gold production |
|
|
|
|
|
|
|
11,996 | 14,199 | 12,886 | 12,256 | 15,584 | 39,081 | 47,093 | |
Silver payable ounces sold | 4,094,203 | 3,318,906 | 3,575,018 | 3,732,076 | 4,457,094 | 10,988,127 | 11,487,556 |
Gold payable ounces sold | 12,706 | 10,151 | 11,533 | 10,484 | 14,277 | 34,390 | 36,389 |
Concentrate volumes produced and sold |
|
|
|
|
|
|
|
|
|
|
|
|
|
| |
Silver concentrate produced, tons | 16,116 | 17,630 | 16,321 | 14,896 | 17,180 | 50,067 | 50,706 |
Silver concentrate sold, tons | 20,516 | 12,601 | 16,295 | 17,333 | 18,954 | 49,412 | 48,239 |
Zinc concentrate produced, tons | 17,065 | 17,990 | 18,474 | 17,485 | 18,548 | 53,529 | 57,712 |
Zinc concentrate sold, tons | 17,114 | 17,796 | 18,467 | 18,918 | 20,065 | 53,377 | 56,436 |
Precious metal concentrate produced, tons | 5,775 | 7,633 | 8,063 | 5,571 | 6,379 | 21,471 | 22,210 |
Precious metal concentrate sold, tons | 6,874 | 8,394 | 15,603 | — | 8,743 | 30,871 | 25,134 |
|
|
|
|
|
|
| |
Silver concentrate produced, tons | 13,758 | 15,452 | 12,635 | 12,283 | 13,796 | 41,845 | 39,942 |
Silver concentrate sold, tons | 14,000 | 15,538 | 12,382 | 12,590 | 13,726 | 41,920 | 39,942 |
Zinc concentrate produced, tons | 7,084 | 6,527 | 6,352 | 6,269 | 6,869 | 19,963 | 20,486 |
Zinc concentrate sold, tons | 7,170 | 6,478 | 6,185 | 7,220 | 6,178 | 19,833 | 20,420 |
|
|
|
|
|
|
| |
Silver concentrate produced, tons | 1,889 | 1,288 | 901 | 1,165 | 2,056 | 4,078 | 5,509 |
Silver concentrate sold, tons | 1,654 | 1,063 | 806 | 1,544 | 2,380 | 3,523 | 5,211 |
Precious metals concentrate produced, tons | 1,361 | 999 | 783 | 815 | 1,398 | 3,143 | 3,090 |
Precious metals concentrate sold, tons (a) | 1,236 | 897 | 798 | 1,023 | 1,258 | 2,931 | 2,806 |
Total Silver Cash Costs and AISC |
|
|
|
|
|
|
|
Silver cash costs per ounce (2) | |||||||
Silver AISC per ounce (3) | |||||||
Greens Creek Cash Costs and AISC |
|
|
|
|
|
|
|
Silver cash costs per ounce (2) | |||||||
Silver AISC per ounce (3) | |||||||
Lucky Friday Cash Costs and AISC |
|
|
|
|
|
|
|
Silver cash costs per ounce (2) | |||||||
Silver AISC per ounce (3) | |||||||
(a) Precious metals concentrates include intersegment sales to | |||||||
Consolidated silver production from continuing operations was 4.2 million ounces, nearly unchanged from the prior quarter. Production decreased 6% at
Gold production from
Silver payable ounces sold of 4.1 million ounces, up 23% from the prior quarter, primarily due to higher payable ounces sold at
Gold payable ounces sold of 13 thousand ounces, up 25% from the prior quarter due to the timing of sales at
Concentrate volumes produced and sold were higher at Keno Hill and for zinc concentrate at Lucky Friday compared to the prior quarter. At
Consolidated silver costs applicable to sales (excludes depreciation) from continuing operations rose 35% over the prior quarter to
Silver cash costs and AISC per silver ounce from continuing operations, excluding
GUIDANCE
In the tables below the Company provides production, cost, and capital guidance on a consolidated basis and by mine, as well as projected consolidated exploration and pre-development expenditures. Silver production guidance is unchanged for
2026 Production Outlook
Consolidated silver production is expected to be 15.3-16.1 million ounces, with low end raised compared to prior guidance of 15.1-16.1 million ounces, and
Greens Creek's silver production is expected to be 8.0-8.3 million ounces, unchanged from prior guidance.Lucky Friday's silver production is expected to be 5.0-5.2 million ounces, with low end raised from the prior 4.9-5.2 million ounces.Keno Hill's silver production is expected to be 2.3-2.6 million ounces, with low end raised from the prior 2.2-2.6 million ounces.
Keno Hill Update
In an attempt to maintain operational continuity, the Company is choosing to suppress
2026 Cost Guidance Improved
Total silver cash cost and AISC guidance per silver ounce is improved to (
- At
Greens Creek , guidance for costs applicable to sales (excludes depreciation) at$250 million , up$10 million from the prior guidance due mostly to actual results over the first nine months and higher expected power generation on site in the fourth quarter. Cash cost per silver ounce and AISC per silver ounce (guidance is improved to ($13.00 )-($12.50 ) and ($5.50 )-($5.00 ) respectively from ($12.50 )-($12.00 ) and ($4.25 )-($3.75 ) respectively.2,3,5
- At Lucky Friday, guidance for costs applicable to sales (excludes depreciation) of
$140 million is reiterated. Cash cost guidance is improved to$8.50-$9.00 from the prior$9.00-$9.75 , per silver ounce, and the higher end of AISC improved slightly to$24.50-$25.50 from$24.50-$26.00 , per silver ounce to reflect better than expected results during the first nine months of 2026, with AISC guidance partly offset by the higher sustaining capital investment guidance at the mine.2,3,5
2026 Capital and
Total capital (growth and sustaining) investment guidance lowered, now at
Greens Creek's capital investment is primarily attributable to mine development and the expansion of its tailings facility, which, when completed is expected to provide tailings storage capacity through 2045.Lucky Friday's capital investment is heavily tied to underground development, a new tailings facility and a surface cooling project, which is now in a commissioning phase (subsequent to quarter end) with construction recently completed. The surface cooling project is designed to increase the cooling capacity at the mine to support its reserve mine-life of fifteen years.- Expected capital investment at Keno Hill comprises mine development, expansion of its tailings facility, and infrastructure projects.
Exploration and pre-development expenditures, from continuing operations, remain unchanged and are expected to be
Metal Prices and FX rate assumptions
Assumptions utilized in the calculation of by-products for the fourth quarter are as follows, gold
|
| Silver Production (Moz) |
| Gold Production (Koz) |
| 8.0 - 8.3 |
| 51.0 - 55.0 | |
| 5.0 - 5.2 |
| N/A | |
| 2.3 - 2.6 |
| N/A | |
2026 Total |
| 15.3 - 16.1 |
| 51.0 - 55.0 |
|
| Costs applicable to sales(5) (millions) |
| Cash cost per silver ounce (2) |
| AISC per produced silver ounce (3) |
| 250 |
| ( |
| ( | |
| 140 |
|
| |||
Total Silver |
| 390 |
| ( |
|
(millions) |
| Total | Sustaining | Growth |
2026 |
| |||
| 55 - 60 | 54 - 58 | 1 - 2 | |
| 79 - 84 | 79 - 84 | - | |
| 55 - 59 | - | 55 - 59 | |
Corporate |
| 9 - 11 | 9 - 11 | - |
2026 Exploration & Pre-Development |
|
|
|
PROJECT PIPELINE UPDATE
Hecla remains focused on advancing a pipeline of organic growth opportunities that build on existing infrastructure, established permitting paths, and the Company's deep operational expertise. The projects outlined below are anticipated to be low-capital-intensity opportunities with the potential to meaningfully expand precious metal output, cash flows and net asset value over time, while reducing many of the exploration and development risks inherent in greenfield projects.
Greens Creek Pyrite Concentrate Circuit
Preliminary cost estimates are underway. Early indications point to a potential return on capital exceeding Company thresholds, while potentially also reducing the rate of tailings deposited into the tailing storage facility, which would be expected to lower future tailings-related capital investment.
This work is at a scoping level of engineering, incorporating some advanced design. Given preliminary indications of favorable benefit-to-cost ratio and perceived low technical risk, the project is well suited to an accelerated engineering and execution path subject to receipt of applicable permits, and final investment approval. Under that path, the Company expects to begin intermittent production of pyrite concentrate in late 2027 using temporary equipment, ahead of completing the new circuit, expected in late 2028.
These estimates are preliminary, based on early-stage engineering and metallurgical work, and remain subject to change as the project advances. Actual results may differ materially from these estimates due to further technical work, permitting timelines, market conditions, and other factors described under "Cautionary Statement Regarding Forward-Looking Statements, Including 2026 Outlook" in this news release and under "Risk Factors" in the Company's 2025 Form 10-K filed on
The Company is also at an early stage of evaluating two additional pathways associated with the dry-stack tailings. The first is based on advances in processing technology and growing market demand for material like Greens Creek tailings, which has created the potential to turn material once managed only as tailings into a marketable low-grade feedstock. This potential project pathway could recover additional silver and gold currently contained in tailings material, subject to further metallurgical testing and the identification of a suitable third-party processing arrangement. In the fourth quarter, we expect to load a test parcel from Greens Creek of approximately 5,500 dry metric tonnes of low-grade feedstock for shipment and sale to a third party smelter. The second option is a potential self-processing pathway that would require an onsite processing facility that could require new or amended permits. The Company expects to begin metallurgical evaluation of the self-processing concept in the first quarter of 2027, with results from this testing potentially available by spring 2027 to help determine potential next steps. The Company expects to be able to provide further details on these options in coming quarters as evaluation work advances. Potential for the combination of two or more of these three options is also being evaluated.
At
Hecla continues to evaluate the potential to restart the existing Midas mill in northern
The Company has allocated
EXPLORATION AND PRE-DEVELOPMENT
Investment and Strategy
During the third quarter, the Company invested
Producing Asset Resource Definition
Underground drilling at Greens Creek and
Greens Creek
Three underground rigs continued drilling around existing resources, with results received from the 200S, East and SWB zones. Notable intercepts include:
- 200S Zone. 63.6 oz/ton silver, 0.01 oz/ton gold, 4.1% zinc and 1.9% lead over 14.1 feet.
- 200S Zone. 48.1 oz/ton silver, 0.11 oz/ton gold, 0.8% zinc and 0.4% lead over 15.9 feet.
East Zone . 6.4 oz/ton silver, 0.04 oz/ton gold, 25.4% zinc and 12.0% lead over 20.7 feet.
One underground rig continued drilling in the
- 54.3 oz/ton silver, 7.4% zinc and 4.7% lead over 4.6 feet, which upgrades the resource.
- 24.8 oz/ton silver, 1.6% zinc and 1.9% lead over 5.0 feet, which expands the resource on the same vein.
EXPLORATION PROGRAMS
Keno Hill Exploration
Exploration drilling at Keno Hill ramped up through the quarter after a period of reduced drilling capacity earlier in the year. The primary contractor returned its second and third drills to service in late July and late August, and a second contractor added one drill at Flame & Moth in late July. Four drills are now operating and are expected to continue through the remainder of 2026.
Flame & Moth, a new zone of high-grade silver
Drilling has been successful in testing the favorable Basal Quartzite on strike with the Lightning vein. The zone has currently been defined over 350 feet of dip length and sits 900 feet southwest of the existing resource. Four holes tested the area and three found significant mineralization. Assays are back for two holes (Figure 1).
- Hole K-26-0944. 26.1 oz/ton silver and 14.0% zinc over 8.5 feet.
- Hole K-26-0951. 6.5 oz/ton silver and 3.5% zinc over 16.1 feet.
The zone is open to the northeast, toward the existing resource, and to the southwest. Follow-up drilling will continue in the fourth quarter and into 2027.
Bermingham Deep, extending a high-grade trend
Drilling at Bermingham Deep extended the high-grade Footwall/Ruby silver trend both southwest and northeast. Key results include 25.7 oz/ton silver and 4.2% lead over 10.0 feet (K-26-0940) and 14.6 oz/ton silver over 5.2 feet (K-26-0935B) in the Footwall Vein. The Ruby Vein returned 9.3 oz/ton silver over 15.8 feet (K-26-0941). The subparallel Main Vein 2 returned 61.1 oz/ton silver and 3.8% lead over 5.3 feet and has been extended about 260 feet to the southwest. Together, the trend now spans about 1,300 feet, up 500 feet from Q2, though that length relies on visual observations from two holes (K-26-0942 and K-26-0945) with assays still pending (Figure 2). The northeast extension points toward the historic
Nevada Exploration
Midas is the only
At Aurora and
Detailed exploration drill assay highlights can be found in Table A at the end of this release.
DIVIDENDS
Pursuant to the Company's dividend policy, the Board of Directors declared a quarterly cash dividend of
CONFERENCE CALL AND WEBCAST
A conference call and webcast will be held on
ABOUT HECLA
Founded in 1891,
NOTES
Non-GAAP Financial Measures
Non-GAAP financial measures are intended to provide additional information only and do not have any standard meaning prescribed by
(1) Free cash flow is a non-GAAP measure calculated as cash provided by operating activities less capital investment. Cash provided by operating activities for the Greens Creek,
(2) Cash cost per silver ounce is a non-GAAP measurement, a reconciliation of costs applicable to sales can be found at the end of the release. It is an important operating statistic that management utilizes to measure each mine's operating performance. It also allows the benchmarking of performance of each mine versus those of our competitors. As a primary silver mining company, management also uses the statistic on an aggregate basis - aggregating the Greens Creek and
(3) All-in sustaining cost (“AISC”) is a non-GAAP measurement, a reconciliation of which to costs applicable to sales, the closest GAAP measurement, can be found in the end of the release. AISC includes costs applicable to sales and other direct production costs, expenses for reclamation at the mine sites and all site sustaining capital costs. AISC is calculated net of depreciation, depletion, and amortization and by-product credits.
Current GAAP measures used in the mining industry, such as total costs applicable to sales, do not capture all the expenditures incurred to discover, develop and sustain silver and gold production. Management believes that AISC is a non-GAAP measure that provides additional information to management, investors and analysts to help (i) in the understanding of the economics of our operations and performance compared to other producers and (ii) in the transparency by better defining the total costs associated with production. Similarly, the statistic is useful in identifying acquisition and investment opportunities as it provides a common tool for measuring the financial performance of other mines with varying geologic, metallurgical and operating characteristics. In addition, the Company may use it when formulating performance goals and targets under its incentive program.
(4) Adjusted EBITDA is a non-GAAP measurement, a reconciliation of which to income from continuing operations, the most comparable GAAP measure, can be found at the end of the release. Adjusted EBITDA is a measure used by management to evaluate the Company's operating performance but should not be considered an alternative to income from continuing operations, or cash provided by operating activities as those terms are defined by GAAP, and does not necessarily indicate whether cash flows will be sufficient to fund cash needs. In addition, the Company may use it when formulating performance goals and targets under its incentive program.
(5) Excludes depreciation, depletion and amortization.
Cautionary Statement Regarding Forward Looking Statements, Including 2026 Outlook
This news release contains "forward-looking statements" within the meaning of Section 27A of the Securities Act of 1933, as amended, and Section 21E of the Securities Exchange Act of 1934, as amended, which are intended to be covered by the safe harbor created by such sections and other applicable laws, including Canadian securities laws. Words such as "may", "will", "should", "expects", "intends", "projects", "believes", "estimates", "targets", "anticipates" and similar expressions are used to identify these forward-looking statements.
Such forward-looking statements may include, without limitation: (i) the Company’s organic project pipeline has potential for meaningful value creation, with the potential to meaningfully expand precious metal output, cash flows and net asset value over time, while reducing many of the exploration and development risks inherent in greenfield projects; (ii) at Greens Creek, (a) the expansion of its tailings facility, when completed, is expected to provide tailings storage capacity through 2045; and (b) the potential new pyrite concentrate circuit (1) could create incremental annual production of approximately 1.0 to 1.2 million ounces of silver and 10,000 to 15,000 ounces of gold from material that currently reports to tailings, once fully ramped up, (2) has a potential robust return on capital meeting Company thresholds, while potentially also reducing the rate of tailings deposited into the tailing storage facility, which would be expected to lower future tailings-related capital investment, (3) has projected favorable benefit-to-cost ratio and perceived low technical risk, and is well suited to an accelerated engineering and execution path, and (4) if approved, could begin intermittent production using temporary equipment in late 2027, with the potential to reach full capacity in late 2028, when construction of the new circuit is expected to be completed; (c) the tailings reprocessing project (1) offers potential organic value creation, (2) completed Phase 3 testing in
The material factors or assumptions used to develop such forward-looking statements or forward-looking information include that the Company’s plans for development and production will proceed as expected and will not require revision as a result of risks or uncertainties, whether known, unknown or unanticipated, to which the Company’s operations are subject. Estimates or expectations of future events or results are based upon certain assumptions, which may prove to be incorrect, which could cause actual results to differ from forward-looking statements. Such assumptions, include, but are not limited to: (i) there being no significant change to current geotechnical, metallurgical, hydrological and other physical conditions; (ii) permitting, development, operations and expansion of the Company’s projects being consistent with current expectations and mine plans; (iii) political/regulatory developments in any jurisdiction in which the Company operates being consistent with its current expectations; (iv) the exchange rate for the USD/CAD being approximately consistent with current levels; (v) certain price assumptions for gold, silver, lead and zinc; (vi) prices for key supplies being approximately consistent with current levels; (vii) the accuracy of our current mineral reserve and mineral resource estimates; (viii) there being no significant changes to the availability of employees, vendors and equipment; (ix) the Company’s plans for development and production will proceed as expected and will not require revision as a result of risks or uncertainties, whether known, unknown or unanticipated; (x) counterparties performing their obligations under hedging instruments and put option contracts; (xi) sufficient workforce is available and trained to perform assigned tasks; (xii) weather patterns and rain/snowfall within normal seasonal ranges so as not to impact operations; (xiii) relations with interested parties, including First Nations and
Cautionary Statements to Investors on Reserves and Resources
This news release uses the terms “mineral resources”, “measured mineral resources”, “indicated mineral resources” and “inferred mineral resources.” Mineral resources that are not mineral reserves do not have demonstrated economic viability. You should not assume that all or any part of measured or indicated mineral resources will ever be converted into mineral reserves. Further, inferred mineral resources have a great amount of uncertainty as to their existence and as to whether they can be mined legally or economically, and an inferred mineral resource may not be considered when assessing the economic viability of a mining project, and may not be converted to a mineral reserve. The Company reports reserves and resources under the SEC’s mining disclosure rules (“S-K 1300”) and Canada’s National Instrument 43-101 – Standards of Disclosure for Mineral Projects (“NI 43-101”) because the Company is a “reporting issuer” under Canadian securities laws. Unless otherwise indicated, all resource and reserve estimates contained in this press release have been prepared in accordance with S-K 1300 as well as NI 43-101.
Qualified Person (QP)
Consolidated Statements of Operations (dollars and shares in thousands, except per share amounts - unaudited) | ||||||||||||||||
|
| Three Months Ended |
| Nine Months Ended | ||||||||||||
|
|
|
|
|
|
|
|
| ||||||||
Sales |
| $ | 394,820 |
|
| $ | 333,851 |
|
| $ | 1,140,104 |
|
| $ | 740,324 |
|
COSTS AND EXPENSES |
|
|
|
|
|
|
|
| ||||||||
Costs applicable to sales (1) |
|
| 158,197 |
|
|
| 117,283 |
|
|
| 399,890 |
|
|
| 345,162 |
|
Depreciation, depletion and amortization |
|
| 36,549 |
|
|
| 36,772 |
|
|
| 107,089 |
|
|
| 98,857 |
|
General and administrative |
|
| 15,582 |
|
|
| 15,173 |
|
|
| 46,508 |
|
|
| 38,411 |
|
Exploration and pre-development |
|
| 17,181 |
|
|
| 11,681 |
|
|
| 33,478 |
|
|
| 22,544 |
|
Care and maintenance |
|
| 3,353 |
|
|
| 3,062 |
|
|
| 9,661 |
|
|
| 10,728 |
|
Provision for closed operations and environmental matters |
|
| 4,017 |
|
|
| 1,329 |
|
|
| 6,643 |
|
|
| 2,902 |
|
Other operating expense, net |
|
| 2,787 |
|
|
| 2,853 |
|
|
| 10,876 |
|
|
| 5,365 |
|
Total costs and expenses |
|
| 237,666 |
|
|
| 188,153 |
|
|
| 614,145 |
|
|
| 523,969 |
|
Income from operations |
|
| 157,154 |
|
|
| 145,698 |
|
|
| 525,959 |
|
|
| 216,355 |
|
Other income (expense): |
|
|
|
|
|
|
|
| ||||||||
Interest expense |
|
| (620 | ) |
|
| (2,413 | ) |
|
| (8,689 | ) |
|
| (35,604 | ) |
Fair value adjustments, net |
|
| 26,691 |
|
|
| (9,246 | ) |
|
| 11,500 |
|
|
| 27,666 |
|
Foreign exchange (loss) gain |
|
| (652 | ) |
|
| (4,445 | ) |
|
| (4,599 | ) |
|
| (3,724 | ) |
Other income, net |
|
| 7,575 |
|
|
| 7,049 |
|
|
| 18,173 |
|
|
| 4,697 |
|
|
|
| 32,994 |
|
|
| (9,055 | ) |
|
| 16,385 |
|
|
| (6,965 | ) |
Income before income and mining taxes |
|
| 190,148 |
|
|
| 136,643 |
|
|
| 542,344 |
|
|
| 209,390 |
|
Income and mining tax provision |
|
| (40,548 | ) |
|
| (18,767 | ) |
|
| (110,215 | ) |
|
| (61,390 | ) |
Income from continuing operations |
|
| 149,600 |
|
|
| 117,876 |
|
|
| 432,129 |
|
|
| 148,000 |
|
(Loss) from discontinued operations, net of income and mining taxes |
|
| — |
|
|
| — |
|
|
| (183,681 | ) |
|
| 39,303 |
|
Net income |
|
| 149,600 |
|
|
| 117,876 |
|
|
| 248,448 |
|
|
| 187,303 |
|
Preferred stock dividends |
|
| (132 | ) |
|
| (132 | ) |
|
| (396 | ) |
|
| (414 | ) |
Net income applicable to common stockholders |
| $ | 149,468 |
|
| $ | 117,744 |
|
| $ | 248,052 |
|
| $ | 186,889 |
|
Basic income per common share from continuing operations after preferred dividends |
| $ | 0.22 |
|
| $ | 0.18 |
|
| $ | 0.64 |
|
| $ | 0.23 |
|
Basic (loss) per common share from discontinued operations |
| $ | — |
|
| $ | — |
|
| $ | (0.27 | ) |
| $ | 0.06 |
|
Basic income per common share after preferred dividends |
| $ | 0.22 |
|
| $ | 0.18 |
|
| $ | 0.37 |
|
| $ | 0.29 |
|
|
|
|
|
|
|
|
|
| ||||||||
Diluted income per common share from continuing operations after preferred dividends |
| $ | 0.22 |
|
| $ | 0.17 |
|
| $ | 0.64 |
|
| $ | 0.23 |
|
Diluted (loss) income per common share from discontinued operations |
| $ | — |
|
| $ | — |
|
| $ | (0.27 | ) |
| $ | 0.06 |
|
Diluted income (loss) per common share after preferred dividends |
| $ | 0.22 |
|
| $ | 0.17 |
|
| $ | 0.37 |
|
| $ | 0.29 |
|
Weighted average number of common shares outstanding basic |
|
| 671,680 |
|
|
| 670,763 |
|
|
| 670,953 |
|
|
| 646,312 |
|
Weighted average number of common shares outstanding diluted |
|
| 676,872 |
|
|
| 675,886 |
|
|
| 676,531 |
|
|
| 649,533 |
|
(1) Excludes depreciation, depletion and amortization | ||||||||||||||||
Consolidated Statements of Cash Flows (dollars in thousands - unaudited) | ||||||||||||||||
|
| Three Months Ended |
| Nine Months Ended | ||||||||||||
|
|
|
|
|
|
|
|
| ||||||||
OPERATING ACTIVITIES |
|
|
|
|
|
|
|
| ||||||||
Net income |
| $ | 149,600 |
|
| $ | 117,876 |
|
| $ | 248,448 |
|
| $ | 187,303 |
|
Less: (Loss) income from discontinued operations, net of taxes |
|
| — |
|
|
| — |
|
|
| (183,681 | ) |
|
| 39,303 |
|
Income from continuing operations |
|
| 149,600 |
|
|
| 117,876 |
|
|
| 432,129 |
|
|
| 148,000 |
|
Non-cash elements included in net income: |
|
|
|
|
|
|
|
| ||||||||
Depreciation, depletion and amortization |
|
| 39,236 |
|
|
| 36,914 |
|
|
| 110,618 |
|
|
| 101,152 |
|
Fair value adjustments, net |
|
| (26,691 | ) |
|
| 9,246 |
|
|
| (11,500 | ) |
|
| (27,666 | ) |
Provision for reclamation and closure costs |
|
| 1,856 |
|
|
| 1,857 |
|
|
| 5,584 |
|
|
| 4,839 |
|
Stock-based compensation |
|
| 3,377 |
|
|
| 3,297 |
|
|
| 9,458 |
|
|
| 7,562 |
|
Deferred income taxes |
|
| (2,015 | ) |
|
| 8,099 |
|
|
| 33,962 |
|
|
| 50,648 |
|
Net foreign exchange loss (gain) |
|
| 652 |
|
|
| 4,445 |
|
|
| 4,599 |
|
|
| 3,724 |
|
Other non-cash items, net |
|
| 1,753 |
|
|
| (119 | ) |
|
| 3,393 |
|
|
| 7,535 |
|
Change in assets and liabilities: |
|
|
|
|
|
|
|
| ||||||||
Accounts receivable |
|
| (6,726 | ) |
|
| 63,174 |
|
|
| 13,480 |
|
|
| (72,461 | ) |
Inventories |
|
| 11,079 |
|
|
| (15,365 | ) |
|
| (3,803 | ) |
|
| (7,812 | ) |
Other current and non-current assets |
|
| 5,350 |
|
|
| (38,528 | ) |
|
| (52,263 | ) |
|
| 14,073 |
|
Accounts payable, accrued and other current liabilities |
|
| 25,724 |
|
|
| (7,322 | ) |
|
| 17,625 |
|
|
| (3,507 | ) |
Accrued payroll and related benefits |
|
| (12,664 | ) |
|
| 19,047 |
|
|
| (8,934 | ) |
|
| 10,093 |
|
Accrued taxes |
|
| 10,624 |
|
|
| (27,476 | ) |
|
| 4,651 |
|
|
| 4,779 |
|
Accrued reclamation and closure costs and other non-current liabilities |
|
| 1,796 |
|
|
| (226 | ) |
|
| 1,793 |
|
|
| (3,372 | ) |
Cash provided by operating activities of continuing operations |
|
| 202,951 |
|
|
| 174,919 |
|
|
| 560,792 |
|
|
| 237,587 |
|
Cash provided by operating activities of discontinued operations |
|
| — |
|
|
| — |
|
|
| 11,324 |
|
|
| 107,996 |
|
Net cash provided by operating activities |
|
| 202,951 |
|
|
| 174,919 |
|
|
| 572,116 |
|
|
| 345,583 |
|
INVESTING ACTIVITIES |
|
|
|
|
|
|
|
| ||||||||
Additions to property, plants, equipment and mine development |
|
| (51,714 | ) |
|
| (39,142 | ) |
|
| (130,121 | ) |
|
| (124,939 | ) |
Proceeds from sale of |
|
| — |
|
|
| 10,136 |
|
|
| 178,181 |
|
|
| — |
|
Proceeds from sale of |
|
| — |
|
|
| — |
|
|
| 5,228 |
|
|
| — |
|
Proceeds from investment sales |
|
| 63,697 |
|
|
| 21,981 |
|
|
| 181,056 |
|
|
| 3,696 |
|
Purchases of investments |
|
| (764 | ) |
|
| (735 | ) |
|
| (57,183 | ) |
|
| — |
|
Proceeds from asset dispositions |
|
| 27 |
|
|
| 4 |
|
|
| 766 |
|
|
| 714 |
|
Net cash provided by (used in) investing activities of continuing operations |
|
| 11,246 |
|
|
| (7,756 | ) |
|
| 177,927 |
|
|
| (120,529 | ) |
Net cash (used in) investing activities of discontinued operations |
|
| — |
|
|
| — |
|
|
| (8,799 | ) |
|
| (45,104 | ) |
Net cash provided by (used in) investing activities |
|
| 11,246 |
|
|
| (7,756 | ) |
|
| 169,128 |
|
|
| (165,633 | ) |
FINANCING ACTIVITIES |
|
|
|
|
|
|
|
| ||||||||
Proceeds from issuance of stock, net |
|
| — |
|
|
| — |
|
|
| 63 |
|
|
| 216,225 |
|
Acquisition of treasury shares |
|
| — |
|
|
| (3,367 | ) |
|
| (4,528 | ) |
|
| (885 | ) |
Repayments of debt, net |
|
| — |
|
|
| (263,000 | ) |
|
| (263,000 | ) |
|
| (274,245 | ) |
Dividends paid to common and preferred stockholders |
|
| (2,790 | ) |
|
| (2,512 | ) |
|
| (8,088 | ) |
|
| (7,676 | ) |
Credit facility costs |
|
| (1,725 | ) |
|
| — |
|
|
| (1,725 | ) |
|
| — |
|
Repayments of finance leases and other |
|
| (1,562 | ) |
|
| (2,497 | ) |
|
| (5,308 | ) |
|
| (5,272 | ) |
Net cash used in financing activities of continuing operations |
|
| (6,077 | ) |
|
| (271,376 | ) |
|
| (282,586 | ) |
|
| (71,853 | ) |
Net cash used in financing activities of discontinued operations |
|
| — |
|
|
| — |
|
|
| (8,431 | ) |
|
| (1,371 | ) |
Net cash used in financing activities |
|
| (6,077 | ) |
|
| (271,376 | ) |
|
| (291,017 | ) |
|
| (73,224 | ) |
Effect of exchange rates on cash |
|
| (33 | ) |
|
| 143 |
|
|
| (220 | ) |
|
| 311 |
|
Net increase (decrease) in cash, cash equivalents and restricted cash and cash equivalents |
|
| 208,087 |
|
|
| (104,070 | ) |
|
| 450,007 |
|
|
| 107,037 |
|
Cash, cash equivalents and restricted cash and cash equivalents at beginning of period |
|
| 484,652 |
|
|
| 588,722 |
|
|
| 242,732 |
|
|
| 28,045 |
|
Cash, cash equivalents and restricted cash and cash equivalents at end of period |
| $ | 692,739 |
|
| $ | 484,652 |
|
| $ | 692,739 |
|
| $ | 135,082 |
|
Consolidated Balance Sheets (dollars and shares in thousands - unaudited) | ||||||||
|
|
|
|
| ||||
ASSETS |
|
|
|
| ||||
Current assets: |
|
|
|
| ||||
Cash and cash equivalents |
| $ | 691,569 |
|
| $ | 241,558 |
|
Accounts receivable |
|
| 169,199 |
|
|
| 182,249 |
|
Inventories |
|
| 85,153 |
|
|
| 81,687 |
|
Other current assets |
|
| 106,241 |
|
|
| 83,065 |
|
Assets of discontinued operations |
|
| — |
|
|
| 40,785 |
|
Total current assets |
|
| 1,052,162 |
|
|
| 629,344 |
|
Investments |
|
| 45,562 |
|
|
| 47,842 |
|
Restricted cash and cash equivalents |
|
| 1,170 |
|
|
| 1,174 |
|
Properties, plants, equipment and mine development, net |
|
| 2,151,987 |
|
|
| 2,130,581 |
|
Operating lease right-of-use assets |
|
| 8,039 |
|
|
| 8,859 |
|
Other non-current assets |
|
| 101,104 |
|
|
| 31,901 |
|
Assets of discontinued operations |
|
| — |
|
|
| 710,944 |
|
Total assets |
| $ | 3,360,024 |
|
| $ | 3,560,645 |
|
|
|
|
|
| ||||
LIABILITIES |
|
|
|
| ||||
Current liabilities: |
|
|
|
| ||||
Accounts payable and other current accrued liabilities |
| $ | 142,569 |
|
| $ | 126,364 |
|
Finance leases |
|
| 4,133 |
|
|
| 4,262 |
|
Accrued reclamation and closure costs |
|
| 13,402 |
|
|
| 13,795 |
|
Accrued interest |
|
| — |
|
|
| 7,678 |
|
Other current liabilities |
|
| 16,553 |
|
|
| 39,107 |
|
Liabilities of discontinued operations |
|
| — |
|
|
| 40,358 |
|
Total current liabilities |
|
| 176,657 |
|
|
| 231,564 |
|
Accrued reclamation and closure costs |
|
| 117,118 |
|
|
| 112,491 |
|
Long-term debt including finance leases |
|
| 7,078 |
|
|
| 263,171 |
|
Deferred tax liability |
|
| 197,648 |
|
|
| 157,585 |
|
Other non-current liabilities |
|
| 39,864 |
|
|
| 33,912 |
|
Liabilities of discontinued operations |
|
| — |
|
|
| 170,276 |
|
Total liabilities |
|
| 538,365 |
|
|
| 968,999 |
|
|
|
|
|
| ||||
STOCKHOLDERS’ EQUITY |
|
|
|
| ||||
Preferred stock |
|
| 38 |
|
|
| 39 |
|
Common stock |
|
| 170,115 |
|
|
| 169,689 |
|
Capital surplus |
|
| 2,653,620 |
|
|
| 2,643,211 |
|
Retained earnings (accumulated deficit) |
|
| 58,354 |
|
|
| (182,143 | ) |
Accumulated other comprehensive loss, net |
|
| (20,124 | ) |
|
| (3,334 | ) |
|
| (40,344 | ) |
|
| (35,816 | ) | |
Total stockholders’ equity |
|
| 2,821,659 |
|
|
| 2,591,646 |
|
Total liabilities and stockholders’ equity |
| $ | 3,360,024 |
|
| $ | 3,560,645 |
|
Common shares outstanding |
|
| 681,230 |
|
|
| 679,220 |
|
Reconciliation of Costs Applicable to Sales to Cash Cost, Before By-product Credits (non-GAAP) and Cash Cost (non-GAAP) and All-In Sustaining Cost, Before By-product Credits (non-GAAP) and All-In Sustaining Cost (non-GAAP)
The tables below present reconciliations between the most comparable GAAP measure of costs applicable to sales to the non-GAAP measures of (i) Cash Cost, Before By-product Credits, (ii) Cash Cost, (iii) AISC, Before By-product Credits and (iv) AISC for our operations and for the Company for the three and nine months ended
Cash Cost and AISC are measures developed by precious metals companies (including the
Cash Cost is an important operating statistic that the Company utilizes to measure each mine's operating performance. The Company uses AISC as a measure of our mines' net cash flow after costs for reclamation and sustaining capital. This is similar to the Cash Cost non-GAAP measure the Company reports, but also includes reclamation and sustaining capital costs. Current GAAP measures used in the mining industry, such as costs applicable to sales, do not capture all the expenditures incurred to discover, develop and sustain silver and gold production. Cash Cost and AISC also allow us to benchmark the performance of each of our mines versus those of our competitors. As a silver and gold mining company, we also use these statistics on an aggregate basis - aggregating the Greens Creek and
Cash Cost, Before By-product Credits and AISC, Before By-product Credits include all direct and indirect operating cash costs related directly to the physical activities of producing metals, including mining, processing and other plant costs, third-party refining expense, on-site general and administrative costs, royalties and mining production taxes. AISC, Before By-product Credits for each mine also includes reclamation and sustaining capital costs. AISC, Before By-product Credits for our consolidated silver properties also includes corporate costs for general and administrative expense and sustaining capital costs. By-product credits include revenues earned from all metals other than the primary metal produced at each unit. As depicted in the tables below, by-product credits comprise an essential element of our silver unit cost structure, distinguishing our silver operations due to the polymetallic nature of their orebodies.
In addition to the uses described above, Cash Cost and AISC per Ounce provide management and investors an indication of operating cash flow, after consideration of the average price received from production. The Company also uses these measurements for the comparative monitoring of performance of our mining operations period-to-period from a cash flow perspective.
In thousands (except per ounce amounts) |
| Three Months Ended |
| Three Months Ended |
| Nine Months Ended |
| Nine Months Ended | ||||||||||||||||||||||||||||||||||||||||
|
| Greens |
| Lucky |
| Keno |
| Corporate (2) |
| Other (4) |
| Total |
| Greens |
| Lucky |
| Keno |
| Corporate (2) |
| Other (4) |
| Total |
| Greens |
| Lucky |
| Keno |
| Corporate (2) |
| Other (4) |
| Total |
| Greens |
| Lucky |
| Keno |
| Corporate (2) |
| Other (4) |
| Total |
Costs applicable to sales (3) |
|
|
|
| $— |
|
|
|
|
|
| $— |
|
|
|
|
|
| $— |
|
|
|
|
|
| $— |
|
| ||||||||||||||||||||
Treatment costs |
| (2,156) |
| (77) |
| — |
| — |
| — |
| (2,233) |
| (3,148) |
| (2,794) |
| — |
| — |
| — |
| (5,942) |
| (4,409) |
| (318) |
| — |
| — |
| — |
| (4,727) |
| 706 |
| 7,451 |
| — |
| — |
| — |
| 8,157 |
Change in product inventory |
| (12,561) |
| (624) |
| — |
| — |
| — |
| (13,185) |
| 9,606 |
| (417) |
| — |
| — |
| — |
| 9,189 |
| (8,338) |
| (1,042) |
| — |
| — |
| — |
| (9,380) |
| 3,227 |
| 332 |
| — |
| — |
| — |
| 3,559 |
Reclamation and other costs |
| (2,560) |
| (251) |
| — |
| — |
| — |
| (2,811) |
| (889) |
| (227) |
| — |
| — |
| — |
| (1,116) |
| (4,295) |
| (673) |
| — |
| — |
| — |
| (4,968) |
| (965) |
| (574) |
| — |
| — |
| — |
| (1,539) |
Exclusion of Keno Hill cash costs (5) |
| — |
| — |
| (25,402) |
| — |
| — |
| (25,402) |
| — |
| — |
| (22,136) |
| — |
| — |
| (22,136) |
| — |
| — |
| (65,461) |
| — |
| — |
| (65,461) |
| — |
| — |
| (56,952) |
| — |
| — |
| (56,952) |
Exclusion of Other costs |
| — |
| — |
| — |
| — |
| (22,403) |
| (22,403) |
| — |
| — |
| — |
| — |
| (10,266) |
| (10,266) |
| — |
| — |
| — |
| — |
| (37,608) |
| (37,608) |
| — |
| — |
| — |
| — |
| (29,903) |
| (29,903) |
Cash Cost, Before By-product Credits (1) |
| 58,890 |
| 33,273 |
| — |
| — |
| — |
| 92,163 |
| 55,480 |
| 31,532 |
| — |
| — |
| — |
| 87,012 |
| 175,411 |
| 102,335 |
| — |
| — |
| — |
| 277,746 |
| 170,470 |
| 98,014 |
| — |
| — |
| — |
| 268,484 |
Reclamation and other costs |
| 934 |
| 225 |
| — |
| — |
| — |
| 1,159 |
| 933 |
| 225 |
| — |
| — |
| — |
| 1,158 |
| 2,801 |
| 675 |
| — |
| — |
| — |
| 3,476 |
| 2,272 |
| 585 |
| — |
| — |
| — |
| 2,857 |
Sustaining capital |
| 12,335 |
| 25,705 |
| — |
| 1,475 |
| — |
| 39,515 |
| 12,188 |
| 19,884 |
| — |
| 2,380 |
| — |
| 34,452 |
| 31,318 |
| 59,852 |
| — |
| 4,863 |
| — |
| 96,033 |
| 28,846 |
| 49,623 |
| — |
| 3,823 |
| — |
| 82,292 |
General and administrative |
| — |
| — |
| — |
| 15,582 |
| — |
| 15,582 |
| — |
| — |
| — |
| 15,173 |
| — |
| 15,173 |
| — |
| — |
| — |
| 46,508 |
| — |
| 46,508 |
| — |
| — |
| — |
| 38,411 |
| — |
| 38,411 |
AISC, Before By-product Credits (1) |
| 72,159 |
| 59,203 |
| — |
| 17,057 |
| — |
| 148,419 |
| 68,601 |
| 51,641 |
| — |
| 17,553 |
| — |
| 137,795 |
| 209,530 |
| 162,862 |
| — |
| 51,371 |
| — |
| 423,763 |
| 201,588 |
| 148,222 |
| — |
| 42,234 |
| — |
| 392,044 |
By-product credits: |
|
|
|
|
|
|
|
|
|
|
|
|
|
|
|
|
|
|
|
|
|
|
|
|
|
|
|
|
|
|
|
|
|
|
|
|
|
|
|
|
|
|
|
|
|
|
|
|
Zinc |
| (27,048) |
| (10,477) |
| — |
| — |
| — |
| (37,525) |
| (26,669) |
| (8,971) |
| — |
| — |
| — |
| (35,640) |
| (79,086) |
| (28,265) |
| — |
| — |
| — |
| (107,351) |
| (69,780) |
| (21,273) |
| — |
| — |
| — |
| (91,053) |
Gold |
| (45,222) |
| — |
| — |
| — |
| — |
| (45,222) |
| (56,935) |
| — |
| — |
| — |
| — |
| (56,935) |
| (157,371) |
| — |
| — |
| — |
| — |
| (157,371) |
| (135,789) |
| — |
| — |
| — |
| — |
| (135,789) |
Lead |
| (5,737) |
| (13,495) |
| — |
| — |
| — |
| (19,232) |
| (6,667) |
| (16,494) |
| — |
| — |
| — |
| (23,161) |
| (18,441) |
| (43,764) |
| — |
| — |
| — |
| (62,205) |
| (19,371) |
| (43,487) |
| — |
| — |
| — |
| (62,858) |
Copper |
| (442) |
| — |
| — |
| — |
| — |
| (442) |
| (311) |
| — |
| — |
| — |
| — |
| (311) |
| (1,186) |
| — |
| — |
| — |
| — |
| (1,186) |
| (2,527) |
| — |
| — |
| — |
| — |
| (2,527) |
Total By-product credits |
| (78,449) |
| (23,972) |
| — |
| — |
| — |
| (102,421) |
| (90,582) |
| (25,465) |
| — |
| — |
| — |
| (116,047) |
| (256,084) |
| (72,029) |
| — |
| — |
| — |
| (328,113) |
| (227,467) |
| (64,760) |
| — |
| — |
| — |
| (292,227) |
Cash Cost |
|
|
| $— |
| $— |
| $— |
|
|
|
| $— |
| $— |
| $— |
|
|
|
| $— |
| $— |
| $— |
|
|
|
| $— |
| $— |
| $— |
| ||||||||||||
AISC |
|
|
| $— |
|
| $— |
|
|
|
| $— |
|
| $— |
|
|
|
| $— |
|
| $— |
|
|
|
| $— |
|
| $— |
| ||||||||||||||||
Ounces produced |
| 1,935 |
| 1,273 |
|
|
|
|
|
|
| 3,208 |
| 2,051 |
| 1,533 |
|
|
|
|
|
|
| 3,584 |
| 6,163 |
| 4,042 |
|
|
|
|
|
|
| 10,206 |
| 6,773 |
| 4,010 |
|
|
|
|
|
|
| 10,783 |
Cash Cost, Before By-product Credits, per Silver Ounce |
|
|
|
|
|
|
|
|
|
|
|
|
|
|
|
|
|
|
|
|
|
|
|
|
|
|
|
|
|
|
|
|
|
|
|
| ||||||||||||
By-product credits per silver ounce |
| (40.54) |
| (18.84) |
|
|
|
|
|
|
| (31.93) |
| (44.16) |
| (16.62) |
|
|
|
|
|
|
| (32.38) |
| (41.55) |
| (17.82) |
|
|
|
|
|
|
| (32.15) |
| (33.58) |
| (16.15) |
|
|
|
|
|
|
| (27.10) |
Cash Cost per Silver Ounce |
|
|
|
|
|
|
|
|
|
|
|
|
|
|
|
|
|
|
|
|
|
|
|
|
|
|
|
|
|
|
|
|
|
|
|
| ||||||||||||
AISC, Before By-product Credits, per Silver Ounce |
|
|
|
|
|
|
|
|
|
|
|
|
|
|
|
|
|
|
|
|
|
|
|
|
|
|
|
|
|
|
|
|
|
|
|
| ||||||||||||
By-product credits per ounce |
| (40.54) |
| (18.84) |
|
|
|
|
|
|
| (31.93) |
| (44.16) |
| (16.62) |
|
|
|
|
|
|
| (32.38) |
| (41.55) |
| (17.82) |
|
|
|
|
|
|
| (32.15) |
| (33.58) |
| (16.15) |
|
|
|
|
|
|
| (27.10) |
AISC per Silver Ounce |
|
|
|
|
|
|
|
|
|
|
|
|
|
|
|
|
|
|
|
|
|
|
|
|
|
|
|
|
|
|
|
|
|
|
|
| ||||||||||||
In thousands (except per ounce amounts) |
| Three Months Ended |
| Three Months Ended |
| Three Months Ended | ||||||||||||||||||||||||||||||
|
| Greens |
| Lucky |
| Keno |
| Corporate (2) |
| Other (4) |
| Total |
| Greens |
| Lucky |
| Keno |
| Corporate (2) |
| Other (4) |
| Total |
| Greens |
| Lucky |
| Keno |
| Corporate (2) |
| Other (4) |
| Total |
Costs applicable to sales (3) |
|
|
|
| $— |
|
|
|
|
|
| $— |
|
|
|
|
|
| $— |
|
| |||||||||||||||
Treatment costs |
| 895 |
| 2,553 |
| — |
| — |
| — |
| 3,448 |
| 242 |
| 2,283 |
| — |
| — |
| — |
| 2,525 |
| (436) |
| 2,434 |
| — |
| — |
| — |
| 1,998 |
Change in product inventory |
| (5,383) |
| (1) |
| — |
| — |
| — |
| (5,384) |
| (4,485) |
| (338) |
| — |
| — |
| — |
| (4,823) |
| (5,106) |
| 946 |
| — |
| — |
| — |
| (4,160) |
Reclamation and other costs |
| (846) |
| (195) |
| — |
| — |
| — |
| (1,041) |
| (537) |
| (283) |
| — |
| — |
| — |
| (820) |
| (715) |
| (141) |
| — |
| — |
| — |
| (856) |
Exclusion of Keno Hill cash costs (5) |
| — |
| — |
| (17,923) |
| — |
| — |
| (17,923) |
| — |
| — |
| (14,931) |
| — |
| — |
| (14,931) |
| — |
| — |
| (23,143) |
| — |
| — |
| (23,143) |
Exclusion of Other costs |
| — |
| — |
| — |
| — |
| (4,939) |
| (4,939) |
| — |
| — |
| — |
| — |
| (8,670) |
| (8,670) |
| — |
| — |
| — |
| — |
| (16,183) |
| (16,183) |
Cash Cost, Before By-product Credits (1) |
| 61,041 |
| 37,530 |
| — |
| — |
| — |
| 98,571 |
| 61,939 |
| 33,492 |
| — |
| — |
| — |
| 95,431 |
| 59,172 |
| 34,409 |
| — |
| — |
| — |
| 93,581 |
Reclamation and other costs |
| 934 |
| 225 |
| — |
| — |
| — |
| 1,159 |
| 757 |
| 195 |
| — |
| — |
| — |
| 952 |
| 758 |
| 195 |
| — |
| — |
| — |
| 953 |
Sustaining capital |
| 6,795 |
| 14,263 |
| — |
| 1,008 |
| — |
| 22,066 |
| 17,516 |
| 19,693 |
| — |
| 1,342 |
| — |
| 38,551 |
| 13,210 |
| 18,484 |
| — |
| 1,528 |
| — |
| 33,222 |
General and administrative |
| — |
| — |
| — |
| 15,753 |
| — |
| 15,753 |
| — |
| — |
| — |
| 19,215 |
| — |
| 19,215 |
| — |
| — |
| — |
| 13,872 |
| — |
| 13,872 |
AISC, Before By-product Credits (1) |
| 68,770 |
| 52,018 |
| — |
| 16,761 |
| — |
| 137,549 |
| 80,212 |
| 53,380 |
| — |
| 20,557 |
| — |
| 154,149 |
| 73,140 |
| 53,088 |
| — |
| 15,400 |
| — |
| 141,628 |
By-product credits: |
|
|
|
|
|
|
|
|
|
|
|
|
|
|
|
|
|
|
|
|
|
|
|
|
|
|
|
|
|
|
|
|
|
|
|
|
Zinc |
| (25,369) |
| (8,816) |
| — |
| — |
| — |
| (34,185) |
| (23,715) |
| (7,666) |
| — |
| — |
| — |
| (31,381) |
| (22,894) |
| (7,203) |
| — |
| — |
| — |
| (30,097) |
Gold |
| (55,214) |
| — |
| — |
| — |
| — |
| (55,214) |
| (44,708) |
| — |
| — |
| — |
| — |
| (44,708) |
| (48,618) |
| — |
| — |
| — |
| — |
| (48,618) |
Lead |
| (6,037) |
| (13,775) |
| — |
| — |
| — |
| (19.812) |
| (5,592) |
| (13,549) |
| — |
| — |
| — |
| (19,141) |
| (6,670) |
| (14,736) |
| — |
| — |
| — |
| (21,406) |
Copper |
| (433) |
| — |
| — |
| — |
| — |
| (433) |
| (938) |
| — |
| — |
| — |
| — |
| (938) |
| (927) |
| — |
| — |
| — |
| — |
| (927) |
Total By-product credits |
| (87,053) |
| (22,591) |
| — |
| — |
| — |
| (109,644) |
| (74,953) |
| (21,215) |
| — |
| — |
| — |
| (96,168) |
| (79,109) |
| (21,939) |
| — |
| — |
| — |
| (101,048) |
Cash Cost |
|
|
| $— |
| $— |
| $— |
|
|
|
| $— |
| $— |
| $— |
|
|
|
| $— |
| $— |
| $— |
| |||||||||
AISC |
|
|
| $— |
|
| $— |
|
|
|
| $— |
|
| $— |
|
|
|
| $— |
|
| $— |
| ||||||||||||
Divided by silver ounces produced |
| 2,177 |
| 1,237 |
|
|
|
|
|
|
| 3,414 |
| 1,952 |
| 1,250 |
|
|
|
|
|
|
| 3,202 |
| 2,348 |
| 1,337 |
|
|
|
|
|
|
| 3,685 |
Cash Cost, Before By-product Credits, per Silver Ounce |
|
|
|
|
|
|
|
|
|
|
|
|
|
|
|
|
|
|
|
|
|
|
|
|
|
|
| |||||||||
By-product credits per silver ounce |
| (39.98) |
| (18.26) |
|
|
|
|
|
|
| (32.11) |
| (38.40) |
| (16.97) |
|
|
|
|
|
|
| (30.03) |
| (33.70) |
| (16.40) |
|
|
|
|
|
|
| (27.42) |
Cash Cost per Silver Ounce |
|
|
|
|
|
|
|
|
|
|
|
|
|
|
|
|
|
|
|
|
|
|
|
|
|
|
| |||||||||
AISC, Before By-product Credits, per Silver Ounce |
|
|
|
|
|
|
|
|
|
|
|
|
|
|
|
|
|
|
|
|
|
|
|
|
|
|
| |||||||||
By-product credits per ounce |
| (39.98) |
| (18.26) |
|
|
|
|
|
|
| (32.11) |
| (38.40) |
| (16.97) |
|
|
|
|
|
|
| (30.03) |
| (33.70) |
| (16.40) |
|
|
|
|
|
|
| (27.42) |
AISC per Silver Ounce |
|
|
|
|
|
|
|
|
|
|
|
|
|
|
|
|
|
|
|
|
|
|
|
|
|
|
| |||||||||
(1) | Includes all direct and indirect operating costs related to the physical activities of producing metals, including mining, processing and other plant costs, third-party refining and marketing expense, on-site general and administrative costs and royalties, before by-product revenues earned from all metals other than the primary metal produced at each operation. AISC, Before By-product Credits also includes reclamation and sustaining capital costs. |
| |
(2) | AISC, Before By-product Credits for our consolidated silver properties includes corporate costs for general and administrative expense and sustaining capital. |
| |
(3) | Excludes depreciation, depletion and amortization |
| |
(4) | Other includes costs applicable to sales related to the Company's environmental remediation services business. |
| |
(5) | |
2026 Guidance, Current Estimates: Reconciliation of Costs Applicable to Sales to Non-GAAP Measures
In thousands (except per ounce amounts) |
| Estimate for Twelve Months Ended | ||||||
|
| Greens Creek |
|
| Corporate(2) |
| Total Silver | |
Costs applicable to sales (3) |
|
|
| $— |
| |||
Treatment costs |
| 2,300 |
| 1,700 |
| — |
| 4,000 |
Other costs |
| (18,700) |
| (4,600) |
| — |
| (23,300) |
Cash Cost, Before By-product Credits (1) |
| 233,200 |
| 136,700 |
| — |
| 369,900 |
Reclamation and other costs |
| 3,700 |
| 900 |
| — |
| 4,600 |
Sustaining capital |
| 57,000 |
| 82,000 |
| 7,000 |
| 146,000 |
General and administrative |
| — |
| — |
| 65,000 |
| 65,000 |
AISC, Before By-product Credits (1) |
| 293,900 |
| 219,600 |
| 72,000 |
| 585,500 |
By-product credits: |
|
|
|
|
|
|
|
|
Zinc |
| (104,600) |
| (40,900) |
| — |
| (145,500) |
Gold |
| (205,300) |
| — |
| — |
| (205,300) |
Lead |
| (25,200) |
| (51,000) |
| — |
| (76,200) |
Copper |
| (1,600) |
| — |
| — |
| (1,600) |
Total By-product credits |
| (336,700) |
| (91,900) |
| — |
| (428,600) |
Cash Cost |
|
|
| $— |
| |||
AISC |
|
|
|
| ||||
Divided by silver ounces produced |
| 8,150 |
| 5,100 |
|
|
| 13,250 |
Cash Cost, Before By-product Credits, per Silver Ounce |
|
|
|
|
| |||
By-product credits per silver ounce |
| (41.31) |
| (18.02) |
|
|
| (32.35) |
Cash Cost per Silver Ounce |
|
|
|
|
| |||
AISC, Before By-product Credits, per Silver Ounce |
|
|
|
|
| |||
By-product credits per silver ounce |
| (41.31) |
| (18.02) |
|
|
| (32.35) |
AISC per Silver Ounce |
|
|
|
|
| |||
Reconciliation of Income from Continuing Operations (GAAP) to Adjusted EBITDA from Continuing Operations (non-GAAP)
This release refers to the non-GAAP measures of adjusted earnings before interest, taxes, depreciation and amortization ("Adjusted EBITDA") from continuing operations, which is a measure of our operating performance. Adjusted EBITDA from continuing operations is calculated as income from continuing operations before the following items: interest expense, income and mining taxes, depreciation, depletion, and amortization expense, ramp-up and suspension costs, gains and losses on disposition of assets, foreign exchange gains and losses, write down of property, plant and equipment, fair value adjustments, net, interest and other income, provisions for closed operations and environmental matters, stock-based compensation, provisional price gains, monetization of zinc and lead hedges and inventory adjustments. Management believes that, when presented in conjunction with comparable GAAP measures, adjusted EBITDA is useful to investors in evaluating our operating performance and ability to meet our debt obligations. The following table reconciles income from continuing operations to adjusted EBITDA from continuing operations:
Dollars are in thousands | 3Q-2026 |
| 2Q-2026 |
| 1Q-2026 |
| 4Q-2025 |
| 3Q-2025 |
|
| LTM |
| YTD 2025 | ||||||||||||||
Income from continuing operations |
| 149,600 |
|
|
| 117,876 |
|
| $ | 164,653 |
|
| $ | 110,059 |
|
| $ | 89,363 |
|
|
|
| 542,188 |
|
| $ | 148,000 |
|
Interest expense |
| 620 |
|
|
| 2,413 |
|
|
| 5,656 |
|
|
| 5,396 |
|
|
| 13,264 |
|
|
|
| 14,085 |
|
|
| 35,604 |
|
Income and mining tax provision |
| 40,548 |
|
|
| 18,767 |
|
|
| 50,900 |
|
|
| 37,351 |
|
|
| 31,030 |
|
|
|
| 147,566 |
|
|
| 61,390 |
|
Depreciation, depletion and amortization |
| 36,549 |
|
|
| 36,772 |
|
|
| 33,768 |
|
|
| 31,185 |
|
|
| 38,481 |
|
|
|
| 138,274 |
|
|
| 101,152 |
|
Care and maintenance |
| 3,353 |
|
|
| 3,062 |
|
|
| 3,246 |
|
|
| 2,060 |
|
|
| 2,003 |
|
|
|
| 11,721 |
|
|
| 6,559 |
|
Loss on disposition of properties, plants, equipment, and mineral interests |
| (5 | ) |
|
| 1,932 |
|
|
| 1,750 |
|
|
| 6 |
|
|
| 2,706 |
|
|
|
| 3,683 |
|
|
| 3,005 |
|
Foreign exchange loss (gain) |
| 652 |
|
|
| 4,445 |
|
|
| (498 | ) |
|
| 2,196 |
|
|
| (436 | ) |
|
|
| 6,795 |
|
|
| 3,724 |
|
Fair value adjustments, net |
| (26,691 | ) |
|
| 9,246 |
|
|
| 5,945 |
|
|
| 19,334 |
|
|
| (19,828 | ) |
|
|
| 7,834 |
|
|
| (27,666 | ) |
Provisional price losses (gains) |
| 7,029 |
|
|
| 7,089 |
|
|
| (848 | ) |
|
| (28,993 | ) |
|
| (10,903 | ) |
|
|
| (15,723 | ) |
|
| (21,969 | ) |
Provision for closed operations and environmental matters |
| 4,017 |
|
|
| 1,329 |
|
|
| 1,297 |
|
|
| 4,965 |
|
|
| 1,268 |
|
|
|
| 11,608 |
|
|
| 2,902 |
|
Stock-based compensation |
| 3,377 |
|
|
| 3,297 |
|
|
| 2,784 |
|
|
| 3,356 |
|
|
| 2,639 |
|
|
|
| 12,814 |
|
|
| 7,562 |
|
Inventory adjustments |
| — |
|
|
| — |
|
|
| — |
|
|
| 8,501 |
|
|
| 51 |
|
|
|
| 8,501 |
|
|
| 2,421 |
|
Other |
| (7,575 | ) |
|
| (7,049 | ) |
|
| (3,549 | ) |
|
| 5,539 |
|
|
| (2,501 | ) |
|
|
| (12,634 | ) |
|
| (5,286 | ) |
Adjusted EBITDA from continuing operations | $ | 211,474 |
|
| $ | 199,179 |
|
| $ | 265,104 |
|
| $ | 200,955 |
|
| $ | 147,137 |
|
|
| $ | 876,712 |
|
| $ | 317,398 |
|
Reconciliation of Cash Provided by Operating Activities from Continuing Operations (GAAP) to Free Cash Flow from Continuing Operations (non-GAAP)
This release refers to a non-GAAP measure of free cash flow from continuing operations, calculated as cash provided by operating activities from continuing operations, less capital investments. Management believes that, when presented in conjunction with comparable GAAP measures, free cash flow from continuing operations is useful to investors in evaluating our operating performance. The following table reconciles cash provided by operating activities from continuing operations to free cash flow from continuing operations:
Dollars are in thousands |
| Three Months Ended |
| Nine Months Ended | ||||||||||||
|
| 2026 |
| 2025 |
| 2026 |
| 2025 | ||||||||
Cash provided by operating activities from continuing operations |
| $ | 202,951 |
|
| $ | 101,556 |
|
| $ | 560,792 |
|
| $ | 237,587 |
|
Less: Capital investment from continuing operations |
|
| (51,714 | ) |
|
| (44,425 | ) |
|
| (130,121 | ) |
|
| (124,939 | ) |
Free cash flow from continuing operations |
| $ | 151,237 |
|
| $ | 57,131 |
|
| $ | 430,671 |
|
| $ | 112,648 |
|
Table A Assay Results – Q3/2026 | |||||||||||
| Prospect, Vein | Drillhole | Drillhole | Sample | Sample | True | Silver | Gold | Lead | Zinc | Depth |
Surface | Bermingham Deep, Bermingham Footwall Vein | K-26-0935B | 277/-60 | 1,997.6 | 2,005.9 | 5.2 | 14.6 | 0.00 | 0.7 | 0.9 | 1,621 |
Bermingham Deep, Bermingham Footwall Vein | including | 277/-60 | 1,997.6 | 2,000.0 | 1.4 | 46.2 | 0.01 | 2.2 | 2.0 | 1,621 | |
Bermingham Deep, Bermingham Footwall Vein | K-26-0940 | 282/-65 | 2,121.1 | 2,137.0 | 10.0 | 25.7 | 0.00 | 4.2 | 0.7 | 1,834 | |
Bermingham Deep, Bermingham Footwall Vein | including | 282/-65 | 2,121.1 | 2,122.2 | 0.7 | 302.3 | 0.05 | 54.6 | 6.8 | 1,834 | |
Bermingham Deep, Bermingham Footwall Vein | K-26-0941 | 286/-63 | 1,857.0 | 1,859.3 | 1.4 | 20.4 | 0.00 | 2.1 | 1.7 | 1,514 | |
Bermingham Deep, Bermingham Main Vein 2 | K-26-0935B | 277/-60 | 1,910.0 | 1,917.9 | 7.6 | 3.4 | 0.00 | 0.2 | 0.7 | 1,558 | |
Bermingham Deep, Bermingham Main Vein 2 | K-26-0940 | 282/-65 | 1,769.4 | 1,774.9 | 5.3 | 61.1 | 0.01 | 3.8 | 0.0 | 1,542 | |
Bermingham Deep, Bermingham Main Vein 2 | K-26-0940 | 282/-65 | 1,795.9 | 1,797.0 | 1.1 | 37.3 | 0.01 | 2.0 | 5.4 | 1,563 | |
Bermingham Deep, | K-26-0935C | 277/-60 | 1,829.7 | 1,838.6 | 7.2 | 1.3 | 0.00 | 0.1 | 0.2 | 1,427 | |
Bermingham Deep, | K-26-0941 | 286/-63 | 1,819.0 | 1,835.1 | 15.8 | 9.3 | 0.00 | 0.6 | 1.0 | 1,487 | |
Bermingham Deep, | including | 286/-63 | 1,821.5 | 1,823.7 | 1.7 | 43.6 | 0.01 | 1.9 | 0.1 | 1,489 | |
Bermingham Deep, | including | 286/-63 | 1,834.3 | 1,839.3 | 3.9 | 12.2 | 0.00 | 1.3 | 2.9 | 1,498 | |
Bermingham Gap, | K-26-0939 | 337/-46.5 | 588.4 | 589.5 | 0.8 | 3.2 | 0.01 | 0.0 | 3.1 | 374 | |
Flame and Moth, Lightning Vein | K-26-0943 | 275/-53 | 1,242.0 | 1,247.2 | 4.8 | 11.7 | 0.00 | 1.4 | 3.6 | 926 | |
Flame and Moth, Lightning Vein | including | 275/-53 | 1,242.0 | 1,244.2 | 2.0 | 26.5 | 0.01 | 3.3 | 7.0 | 926 | |
Flame and Moth, Lightning Vein | K-26-0944 | 254/-48 | 1,448.0 | 1,458.6 | 8.5 | 26.1 | 0.01 | 0.7 | 14.0 | 1,030 | |
Flame and Moth, Lightning Vein | including | 254/-48 | 1,448.0 | 1,451.0 | 2.4 | 60.8 | 0.01 | 0.7 | 13.8 | 1,030 | |
Flame and Moth, Lightning Vein | K-26-0947 | 242/-59 | 1,581.8 | 1,589.4 | 5.8 | 4.5 | 0.02 | 0.6 | 0.1 | 1,278 | |
Flame and Moth, Lightning Vein | K-26-0951 | 298/-65 | 953.7 | 975.1 | 16.1 | 6.5 | 0.00 | 0.4 | 3.5 | 795 | |
Flame and Moth, Lightning Vein | including | 298/-65 | 953.7 | 954.7 | 0.7 | 12.1 | 0.00 | 2.9 | 6.3 | 795 | |
Flame and Moth, | K-26-0947 | 242/-59 | 1,424.9 | 1,426.2 | 1.0 | 2.0 | 0.01 | 0.4 | 0.8 | 1,165 | |
| Mine, Zone, Vein | Drillhole | Drillhole | Sample | Sample | True | Silver | Gold | Lead | Zinc | Depth |
Underground | BMUG26-302 | 146/-6 | 385.6 | 386.2 | 0.4 | 81.1 | 0.03 | 4.3 | 0.8 | 1,283 | |
BMUG26-317 | 115/-9 | 489.8 | 490.2 | 0.3 | 11.3 | 0.00 | 0.2 | 0.0 | 1,280 | ||
BMUG26-318 | 125/-8 | 473.6 | 479.3 | 4.6 | 54.3 | 0.01 | 4.7 | 7.4 | 1,302 | ||
including | 125/-8 | 473.6 | 476.9 | 2.8 | 81.5 | 0.01 | 7.8 | 12.5 | 1,302 | ||
BMUG26-320 | 125/-15 | 515.3 | 521.7 | 5.0 | 24.8 | 0.01 | 1.9 | 1.6 | 1,378 | ||
including | 125/-15 | 519.7 | 521.1 | 1.1 | 79.9 | 0.01 | 4.1 | 1.3 | 1,378 | ||
Midas ( | |||||||||
| Zone | Drillhole | Drillhole | Sample | Sample | True | Gold | Silver | Depth |
Surface | Sinter Offset Southeast | DMC-491 | 039/-48 | 841.1 | 842.0 | 0.8 | 0.30 | 3.5 | -615 |
Sinter Offset Southeast | DMC-495 | 032/-48 | 1,108.0 | 1,111.8 | 2.7 | 0.06 | 0.3 | -815 | |
Sinter Resource | DMC-487 | 192/-45 | 759.0 | 761.9 | 2.1 | 0.14 | 0.9 | -530 | |
Sinter Resource | DMC-487 | 192/-45 | 961.4 | 963.8 | 1.8 | 0.03 | 0.4 | -665 | |
Sinter Resource | DMC-493 | 040/-68 | 994.7 | 996.1 | 1.0 | 0.07 | 0.1 | -975 | |
Pogo Sinter Gap | DMC-494 | 045/-45 | 1,274.6 | 1,276.6 | 1.4 | 0.73 | 2.9 | -855 | |
Pogo Sinter Gap | including | 045/-45 | 1,274.6 | 1,276.0 | 1.0 | 0.99 | 3.7 | -855 | |
Pogo Sinter Gap | DMC-494 | 045/-45 | 1,681.2 | 1,681.7 | 0.4 | 0.79 | 0.4 | -1,110 | |
Pogo Sinter Gap | DMC-496 | 080/-45 | 1,236.3 | 1,245.6 | 6.6 | 0.03 | 0.8 | -870 | |
Pogo Sinter Gap | including | 080/-45 | 1,240.1 | 1,240.7 | 0.4 | 0.18 | 5.1 | -870 | |
Greens Creek ( | |||||||||||
| Zone | Drillhole | Drillhole | Sample | Sample | True | Silver | Gold | Lead | Zinc | Depth |
Underground | 200s | GC6777 | 315.4/-12.5 | 433.5 | 448.0 | 14.1 | 63.6 | 0.01 | 1.9 | 4.1 | -742 |
200s | GC6836 | 251.2/-21.9 | 129.0 | 158.2 | 7.6 | 18.6 | 0.02 | 3.0 | 5.6 | -1,558 | |
200s | GC6837 | 256.1/-47.6 | 366.8 | 371.7 | 4.8 | 14.3 | 0.01 | 0.3 | 0.8 | -1,776 | |
200s | GC6847 | 252.2/-61.1 | 321.2 | 342.0 | 20.8 | 16.5 | 0.02 | 0.3 | 0.7 | -1,794 | |
200s | GC6850 | 244/-55.4 | 347.4 | 361.4 | 14.0 | 23.3 | 0.04 | 0.3 | 0.6 | -1,791 | |
200s | GC6853 | 264.3/-75 | 384.4 | 405.1 | 15.9 | 48.1 | 0.11 | 0.4 | 0.8 | -1,882 | |
EAST | GC6812 | 75.3/20.2 | 520.0 | 543.0 | 20.7 | 6.4 | 0.04 | 12.0 | 25.4 | 858 | |
SWB | GC6840 | 105.8/-72 | 269.1 | 285.0 | 12.2 | 13.2 | 0.02 | 3.9 | 13.3 | -859 | |
SWB | GC6846 | 78.3/-78.3 | 253.1 | 265.5 | 12.2 | 10.7 | 0.02 | 3.4 | 11.5 | -407 | |
View source version on businesswire.com: https://www.businesswire.com/news/home/20261103366765/en/
For further information, please contact:
Vice President - Strategy and Investor Relations
Investor Relations Coordinator
Investor Relations
Email: hmc-info@hecla.com
Website: http://www.hecla.com
Source: